Drop Date: June 2023
By Douglas A. Granger and Kristina Feghali
It appears that your browser may be outdated and performance may be limited. The My Study builder is best viewed with the latest internet browsers. However, if you’d prefer to use our standard form, you can access it below.
Drop Date: June 2023
By Douglas A. Granger and Kristina Feghali
In the biobehavioral sciences, one of the most challenging issues is estimating statistical power. The underlying question is:
“Does the study design include enough participants to rule out the possibility that observations made would be unlikely to have occurred by chance?”
This issue is center stage in the peer review of grant proposals as well as manuscripts submitted for publication.
Most salivary bioscience studies employ models that involve multi-method or -modal assessments in an effort to explain individual differences. Here, the task of estimating statistical power becomes even more daunting. The integration of biological and behavioral measures increases the potential for variables included to have different distributional properties and measurement errors. Moreover, the exploration of individual differences often demands analytical tactics that subgroup participants by key variables. Without guard rails or guidelines, investigators are making decisions about sample size based on a combination of opinions, assumptions, and budget restrictions. These choices directly impact whether proposals are funded, and if the resulting manuscripts are accepted for publication in top journals.
Over 25 years, we have engaged hundreds of investigators from the proposal planning through the publication and presentation of study findings. An anecdotal observation is that sometimes the number of participants included in project proposals is less than optimal from the outset, and/or at the end-line, investigators may not have a sufficient sample size (N, the number of participants) to analyze subgroup differences and test compelling secondary or tertiary research questions.
Our experience suggests that it would be helpful to investigators in the study planning stage to raise awareness of these specialized issues and start a dialogue that encourages consideration of best practice recommendations.
To begin, we take a data-driven approach. We asked a simple question: In the published literature, what is the distribution of N for studies that explore relationships with salivary bioscience measurements? Our assumption was that to pass peer review, studies in the literature had to include a sufficient N to reveal at least one statistically significant finding. So, we searched PubMed (since 2017) using specific keywords for three different common salivary bioscience study designs, listed the studies in descending order, and summarized our observations. We selected 101 qualified studies, blind to N, that focused on the Cortisol Awakening Response (i.e., keywords were “CAR”, “Saliva”, and “Cortisol Awakening Response”), 101 qualified studies on the Cortisol Diurnal (i.e., keywords were “saliva” and “diurnal sampling”), and 101 qualified studies that employed the Trier Social Stress Test (i.e., keywords” TSST” and “Saliva”).
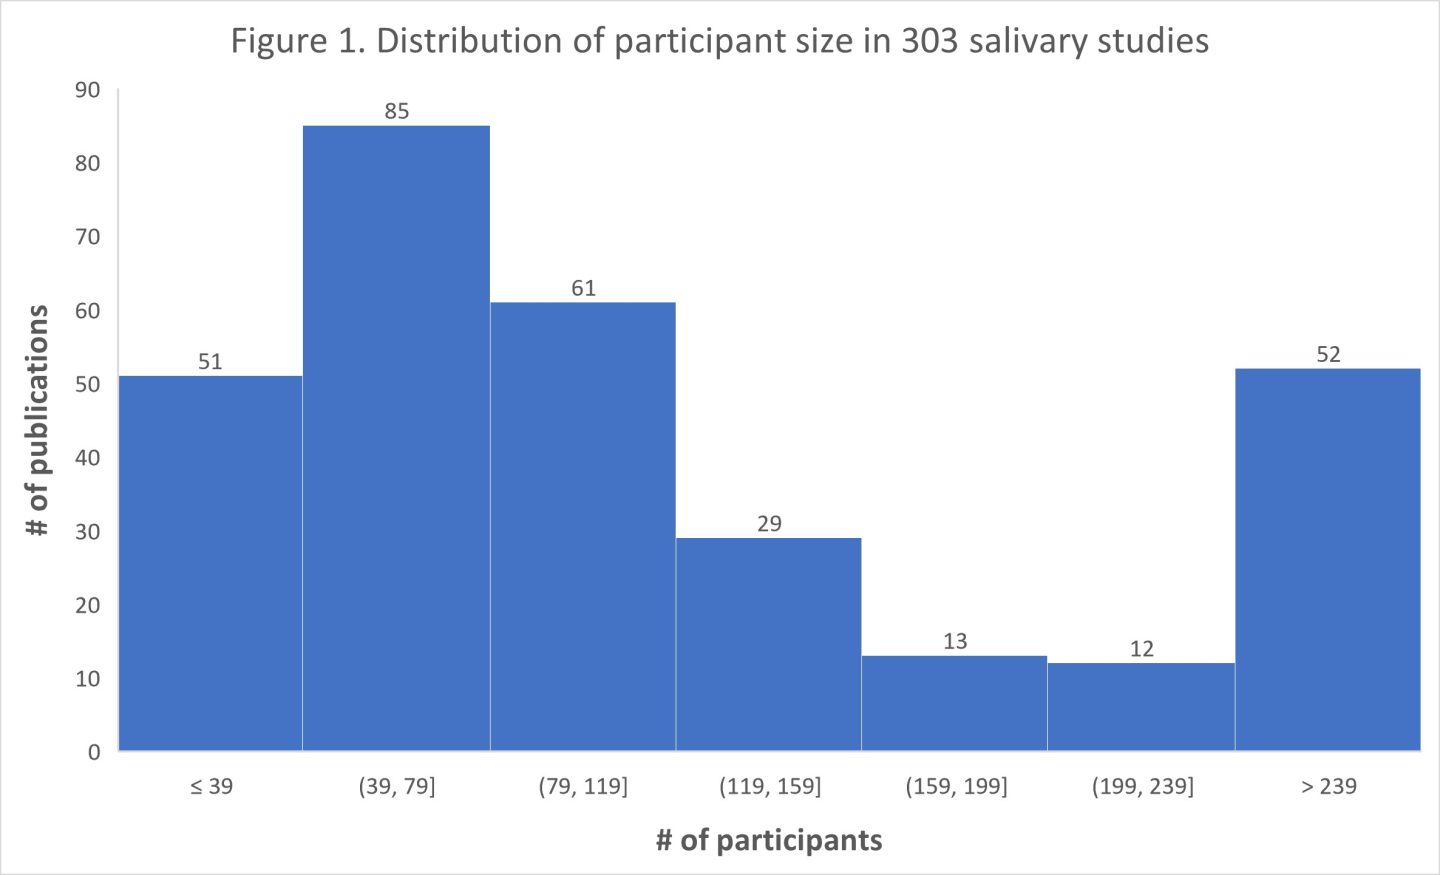
In summary, our analysis of the 303 studies revealed a median value of 90 participants. Furthermore, we observed that 51 studies had a sample size of 39 participants or fewer, suggesting a potential limitation in their ability to detect a statistically significant correlation of moderate size at a significance level of p < 0.05. Figure 1. below shows the number of studies with various numbers of participants.
To see additional in-depth additional figures for each study type, please click here. Each graph depicts the distributions of N for each study type: Cortisol Awakening Response, Cortisol Diurnal, and Trier Social Stress Test. You’ll notice the distributions are non-normal, and for this reason, we draw the reader’s attention to the median as the measure of central tendency.
Table 1. N by study type: percentiles, mean, median, standard deviation, and range
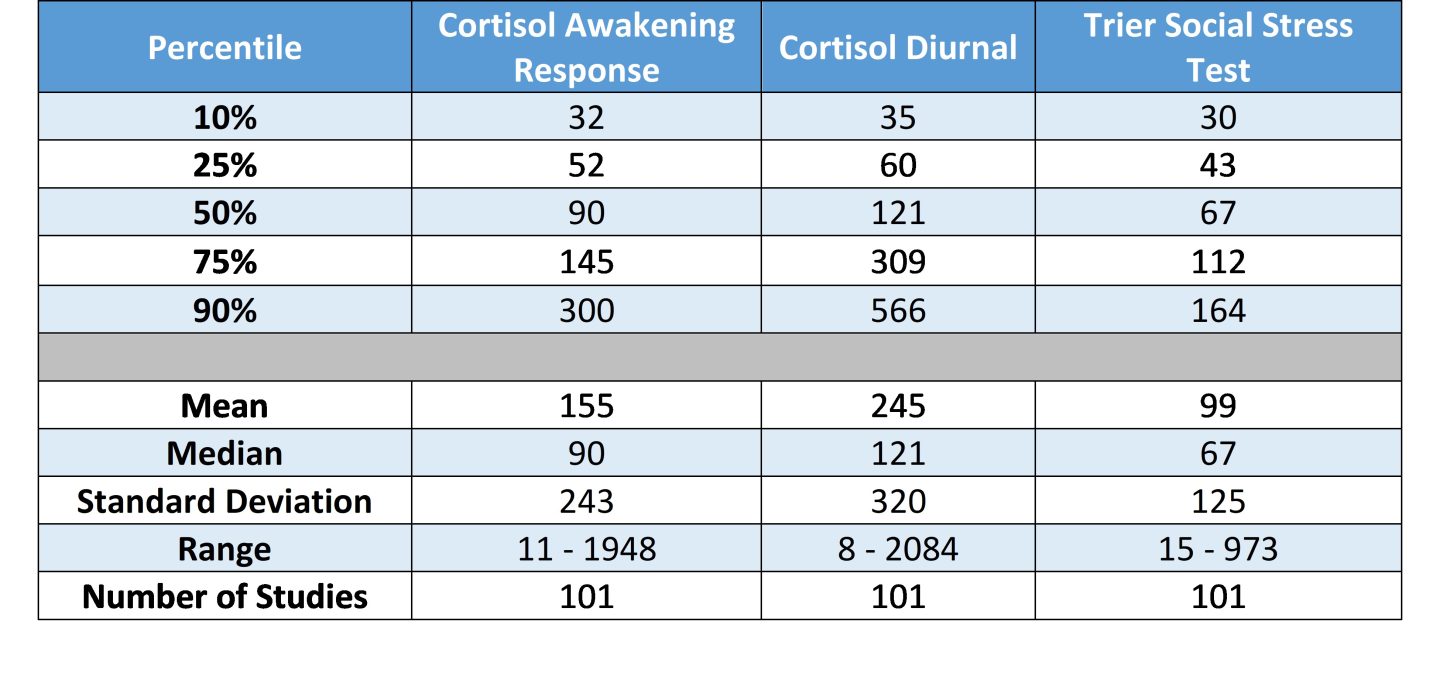 It’s our expectation that these tabled values will serve as general guidelines regarding the number of participants investigators should plan to include in their proposals. Since the studies included in this summary have each passed through the peer review process, we argue these figures have internal and external validity and can be used to complement more technically derived estimates of statistical power.
Moreover, we anticipate that despite the best of intentions that it is more common than not that at the end-line, studies fall short of the projected sample size due to unanticipated issues with the execution of recruitment and participant dropout/retention. Therefore, we forward these figures to frame estimates of sample size in completed studies after recruitment and retention issues that have had an impact. Investigators should consider accommodation of recruitment and retention problems in their project plans and projections.
These data suggest that a considerable number of studies in this literature may be underpowered. An observation often corroborated by the authors themselves. Many of these studies mention sample size as a limitation in their discussions and recommend a larger sample size in future studies.
Budget ceilings almost certainly impact project plans related to sample size. The cost of analytical services for testing salivary samples is a significant contributor to most proposed budgets. It is logical to think that larger sample size is prohibitive because they generate more samples, which are directly tied to increased expenses. We recently showed that this doesn’t necessarily have to be the case. Our prior effort emphasizes prioritizing biological replicates over technical replicates. Please see Riis, Jenna L et al. “The case for the repeatability intra-class correlation as a metric of precision for salivary bioscience data: Justification, assessment, application, and implications.” Psychoneuroendocrinology vol. 128 (2021): 105203, and see the commentary in Maximizing the Scientific Value of Saliva as a Biospecimen: A Guide for Research for additional details.
By considering these specialized issues, researchers can enhance the rigor and quality of their salivary bioscience studies. Salimetrics is committed to supporting researchers and encouraging ongoing dialogue and collaboration to advance the field of salivary bioscience.
For more information, researchers are encouraged to connect with an expert at Salimetrics. Additionally, researchers in the planning stages of their study can utilize the project summary, a resource available on the website to develop their study plan, including the option to input their desired sample and participant type and size.
Another resource available to salivary bioscience researchers is the Collaboratory which offers an opportunities for researchers to discuss and develop grant proposal and innovative ideas with salivary experts.
*Note: Salimetrics provides this information for research use only (RUO). Information is not provided to promote off-label use of medical devices. Please consult the full-text article.
 Contact: Salimetrics (USA)
Experts in Saliva & Dried Blood Spot Testing for Research
The best science for your study
OR CALL 800.790.2258
X