It appears that your browser may be outdated and performance may be limited. The My Study builder is best viewed with the latest internet browsers. However, if you’d prefer to use our standard form, you can access it below.

Go to Internet Explorer Quick Quote Form

Dismiss this message

Dried Blood Spots

Expand your biomarker research with minimally invasive DBS collection and validated analysis. Supported by scientific experts.

Salimetrics is pleased to offer a new initiative developed in coordination with leading Dried Blood Spot expert Thomas McDade, PhD

  • Validated DBS assays for CRP, HbA1c, and inflammatory cytokines (IL-6, IL-10, TNF-α)
  • End-to-end support: study planning → collection guidance → analysis → results
  • Research-focused expertise and logistical support

Ready to Get Started?

Validated Dried Blood Spots Analytes Available

dreid-blood-spot

C-Reactive Protein (CRP)

Systemic inflammation biomarker for research applications.

dreid-blood-spot

Hemoglobin A1c (HbA1c)

Long-term glycemic control biomarker for metabolic research.

dreid-blood-spot

Inflammatory Cytokines

IL-6, IL-10, TNF-α for inflammatory research.

How it Works

Plan

Consult with an experienced study team on your goals, populations, and analytes

Collect

Collect samples with unparalleled DBS collection guidance and logistics support

Analyze

Validated DBS assays run by the CoreLab+ and backed by the Salimetrics Commitment

Report

Clear, accurate, and reproducible results ready for analysis

Need Pricing and Turnaround Time?

Request a quote for DBS analysis based on your analytes, sample count, and study design.

Not Sure What to Measure?

Ask an expert about selecting DBS analytes, collection logistics, and integrating DBS into your study.

 More About DBS Biomarkers

C-reactive protein (CRP) is a well-characterized acute-phase reactant synthesized by hepatocytes in response to pro-inflammatory cytokines, particularly interleukin-6 (IL-6). Its role as a systemic biomarker for inflammation makes it valuable in studying both acute and chronic inflammatory states, such as cardiovascular disease, metabolic syndrome, and autoimmune conditions. CRP levels are highly predictive of long-term cardiovascular risk and are a key marker in studies investigating the intersection of inflammation, metabolic health, and chronic disease progression. Measuring CRP with DBS is particularly advantageous for assessing the responsiveness of systemic inflammation to lifestyle interventions such as dietary modification, physical activity, and weight loss, as well as broader social and economic determinants of health.

The Salimetrics Core Lab is supported by the latest advancements in DBS analysis, as demonstrated in published research, including the work of Thomas McDade, Ph.D., who also serves as a scientific advisor for DBS studies. This ensures that Salimetrics’ methodologies align with the expected performance standards established by experts in the field.

Figure 1. Method Comparison of Salimetrics DBS CRP assay and CalBiotech plasma CRP assay using Deming Regression. CRP Levels in Plasma vs DBS for both neat and spiked samples. Spiked samples are those above 10 mg/mL The solid line indicates the Deming regression fit. Spearman correlation of r = 0.98. These data also show an average percent difference of 3.47 % +/- 3.11 between the methods.

Hemoglobin A1c is a robust biomarker for long-term glycemic control, reflecting average blood glucose concentrations over the lifespan of erythrocytes (~2-3 months). It is widely used in epidemiological and clinical research for the assessment of diabetes risk and management. Elevated HbA1c levels are associated with increased risk of microvascular and macrovascular complications, making it a critical marker for researchers studying metabolic health, particularly in the context of obesity, insulin resistance, and diabetes. Using dried blood spots for HbA1c quantification provides a practical and scalable method for researchers investigating metabolic health outcomes across diverse populations. The frequent and convenient collection of DBS can facilitate monitoring of HbA1c trends in response to behavioral interventions, providing a clearer understanding of the impact of lifestyle changes on glycemic control over time.

The Salimetrics Core Lab is supported by the latest advancements in DBS analysis, as demonstrated in published research, including the work of Thomas McDade, Ph.D., who also serves as a scientific advisor for DBS studies. This ensures that Salimetrics’ methodologies align with the expected performance standards established by experts in the field.

Figure 1. Method comparison between samples of whole blood and matched DBS using the BioRad D10 analyzer to measure HbA1c percentages. Data in Table 5 was analyzed using Deming linear-regression using Prism Graphpad. Pearson correlation of r = 0.93. These data also show a mean bias between methods of +/- 0.34 HbA1c %-points.

IL-6 and TNF-α are critical pro-inflammatory cytokines involved in the regulation of immune responses and inflammation. IL-6 functions as both a pro- and anti-inflammatory mediator and is particularly relevant in studies of metabolic dysregulation, insulin resistance, and obesity. TNF-α is implicated in the pathogenesis of a wide range of inflammatory conditions, including insulin resistance, cardiovascular disease, and cancer, due to its potent role in inducing systemic inflammation.

 IL-10 is an anti-inflammatory cytokine that plays a key regulatory role in suppressing excessive immune responses and mitigating tissue damage.  It counteracts the effects of pro-inflammatory cytokines like IL-6 and TNF-α, making it an important marker for immune regulation and homeostasis in chronic inflammatory conditions.

The Salimetrics Core Lab is supported by the latest advancements in DBS analysis, as demonstrated in published research, including the work of Thomas McDade, Ph.D., who also serves as a scientific advisor for DBS studies. This ensures that Salimetrics’ methodologies align with the expected performance standards established by experts in the field.

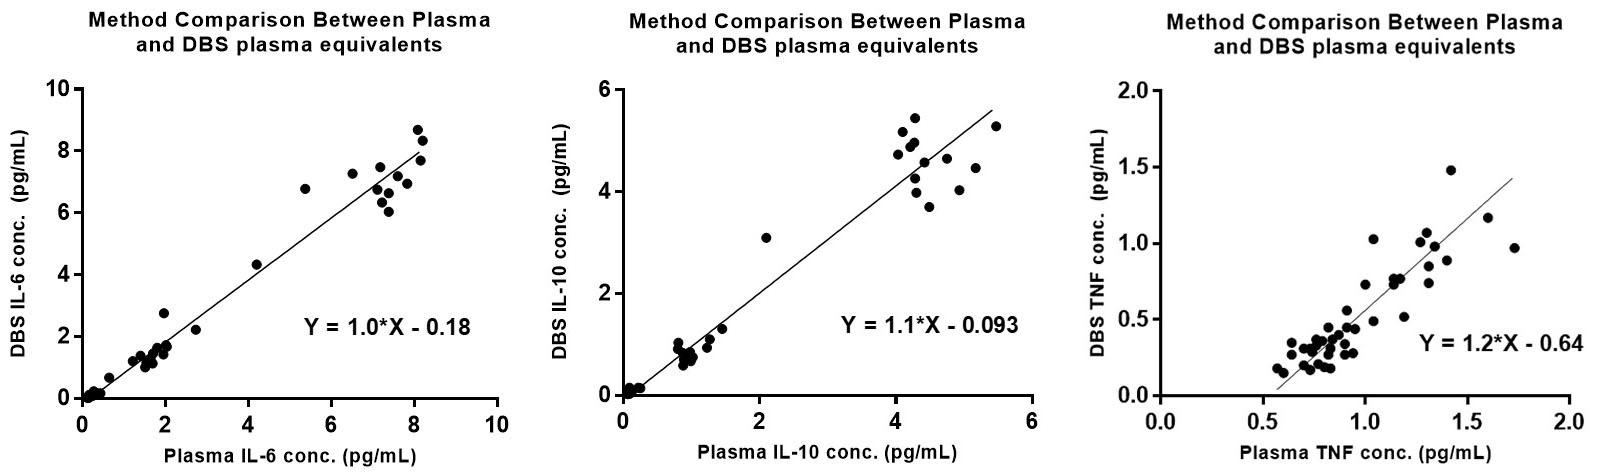
Figure 1. Method comparison between matched samples of whole blood DBS and plasma. The solid line indicates the Deming regression fit with Spearman correlations of r = 0.97 (IL-6), r = 0.92 (IL-10), and r = 0.86 (TNF-alpha).

Just starting out?

Check out the Dried Blood Spots Sample Collection Handbook:

WordPress Cookie Plugin by Real Cookie Banner
Contact: Salimetrics (USA)
View All International Distributors