 Contact: Salimetrics (USA)
Need Help?
Ask an expert


1. How to collect Salivary Insulin
APPROVED SALIVARY INSULIN COLLECTION METHODS
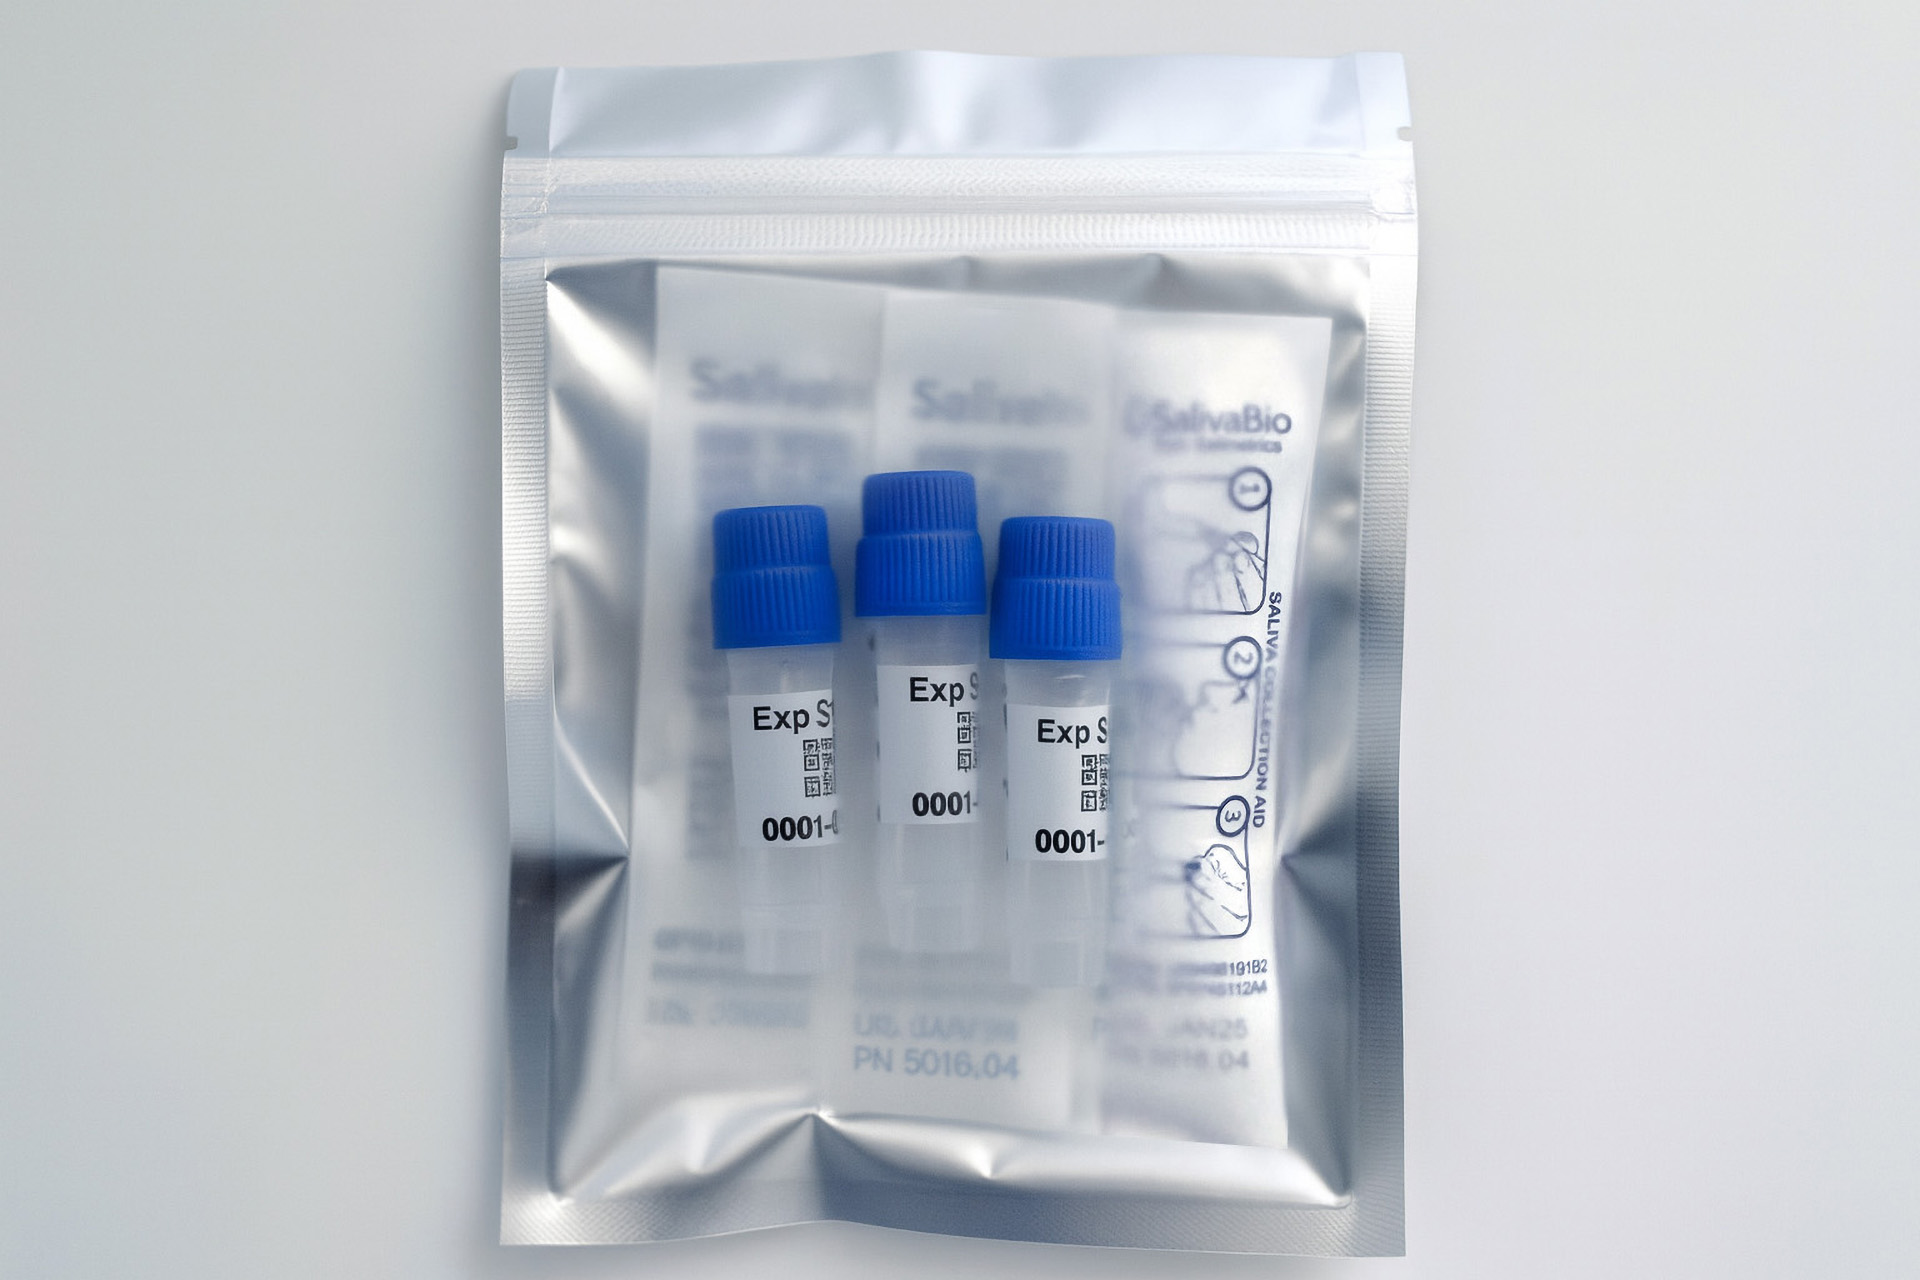
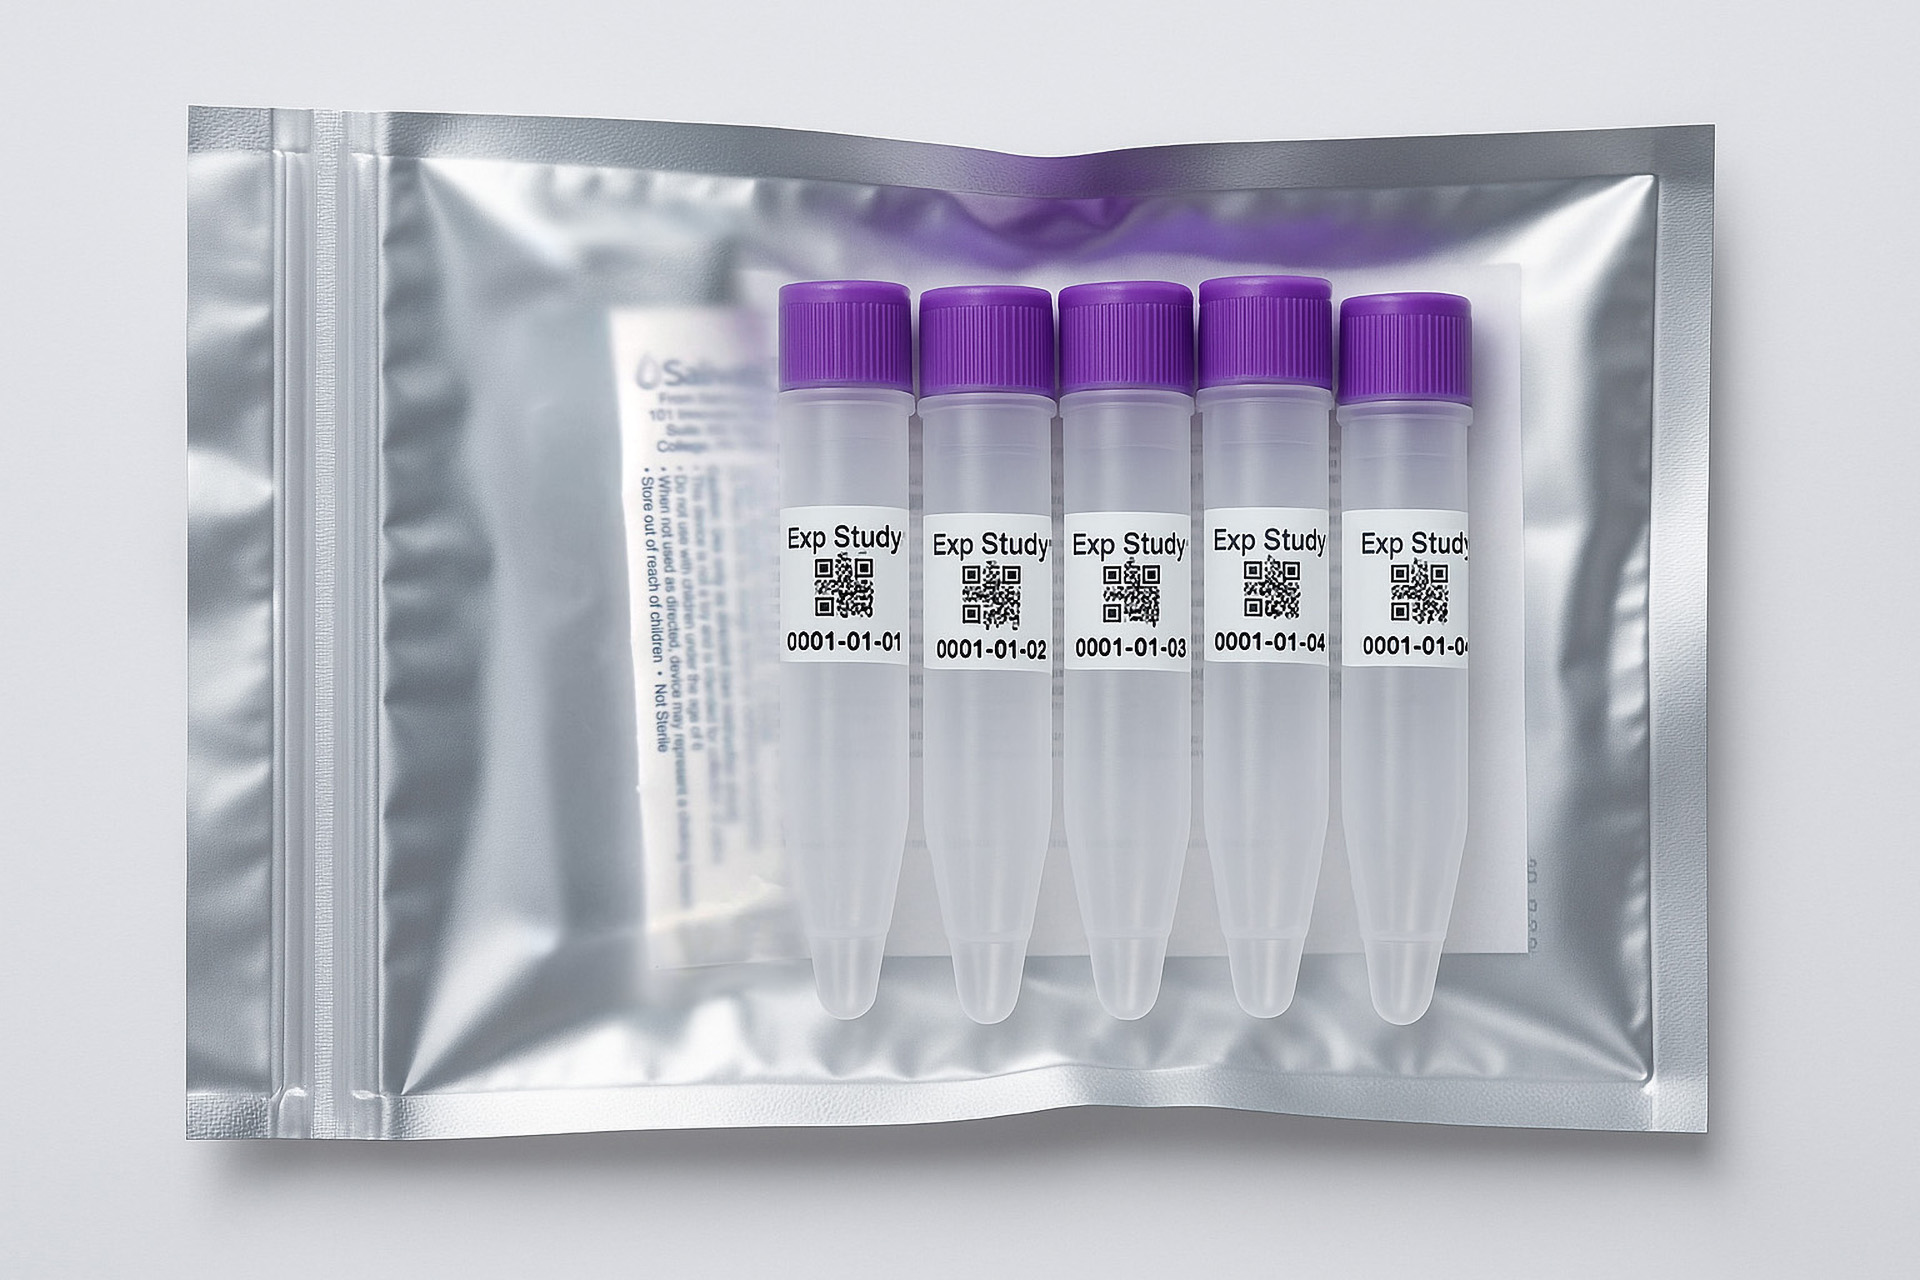
Salivary Insulin Collection Protocol
Collection volume, general considerations, and basic guidelines to maximize salivary insulin sample integrity. Use this analyte-specific collection protocol to plan you collection methodology and sampling schemes.

2. How to Assay for Salivary Insulin
Send Saliva Samples to Salimetrics
Add to StudyEasy and accurate results from the Salimetrics CoreLab+ Laboratory.
Order Code5452
Salivary Insulin ELISA Kit
Add to Study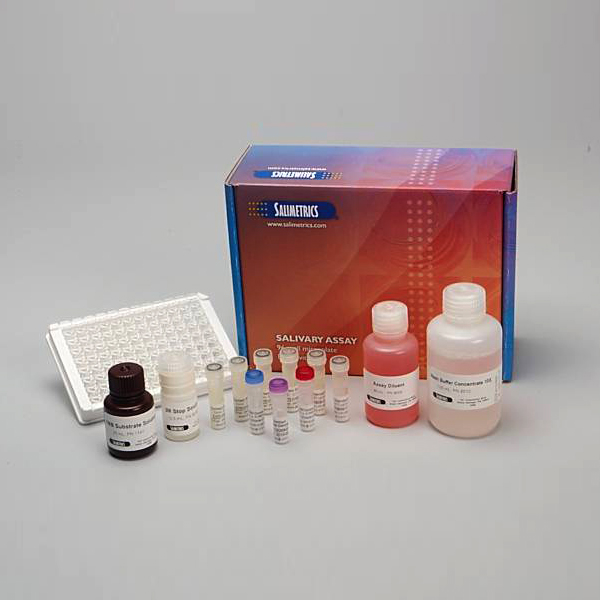
Salimetrics Assay #1-4210
The Salimetrics® Insulin ELISA Kit is specifically designed for the quantitative measurement of salivary insulin and requires only a low sample volume. This kit allows researchers to easily and painlessly collect multiple samples, facilitating studies on obesity and metabolics without the need for repeated blood draws.
Insulin, a core anabolic peptide hormone, regulates the metabolism of nutrients such as glucose and fatty acids, promoting their absorption into fat, liver, and skeletal muscle cells. Salivary insulin presents a unique opportunity to monitor insulin levels prior to and associated with disease progression. Elevated fasting insulin is a hallmark of insulin resistance, which can precede type 2 diabetes by several years and may justify lifestyle changes to reduce disease risk. Salivary insulin correlates closely with fasting blood levels and offers a reliable surrogate for serum measures.
Read More...| Assay Protocol |
|---|
| Rev. 08.15.25
|
| Specifications | |
|---|---|
| Catalog#: | 1-4210 |
| Regulatory Status: | RUO |
| Format: | 96-well plate |
| Assay Time: | ~ 1 hr 15min |
| Sample Volume/Test: | 25 µL |
| Sensitivity: | 0.39 µIU/mL |
| Assay Range: | 0.39 – 300 µIU/mL |
| Storage Requirements: | 2-8°C |
| Tests Per Kit | |
|---|---|
| Singlet: | 76 |
| Duplicate: | 38 |
| Target Analyte |
|---|
Technical Documentation
Assay Kit Overview
Intended Use
The Salimetrics® Insulin ELISA Kit is an indirect sandwich ELISA specifically designed and validated for the quantitative measurement of salivary Insulin. It is not intended for diagnostic use. It is intended only for research use in humans and some animals. Salimetrics has not validated this kit for serum or plasma samples.
Introduction
Insulin, a critical peptide hormone produced by the pancreatic β-cells, regulates glucose homeostasis and energy metabolism by facilitating the uptake of glucose into cells and influencing carbohydrate, protein and lipid metabolism, as well as cell division and growth. The lack of Insulin production in Type I Diabetes Mellitus, caused by autoimmune islet destruction, results in pathogenic levels of glucose in the blood and requires exogeneous Insulin administration. Type II Diabetes Mellitus is caused by the lack of Insulin activity referred to as Insulin Resistance. Elevated fasting Insulin levels and/or the dysregulation of Insulin after ingestion of glucose over time are diagnostic hallmarks of Insulin resistance. In many cases, people are unaware of their pre-diabetic state since Insulin resistance can occur prior before systemic glucose levels become problematically high. Fortunately, Insulin Resistance is reversible by behavioral health changes which present an important opportunity for a pre-diabetic individual to avoid Type II Diabetes altogether.
Traditionally measured in serum, advancements now allow for the assessment of Insulin levels in saliva, providing a non-invasive, simpler alternative for research involving frequent sampling. In saliva, Insulin shares a nearly linear correlation to fasting blood levels (r = 0.92) and is a reliable surrogate for serum measurements as shown in the figure below. The detection of salivary Insulin has a crucial temporal aspect; there is an approximate 40-minute delay in salivary Insulin response compared to serum after a glucose challenge. Saliva collection reduces patient discomfort, risk of infection, and the need for specialized medical staff, making it particularly beneficial for vulnerable groups and suitable for large-scale studies or fieldwork. One significant benefit of measuring Insulin in saliva is the ability to easily and painlessly collect multiple samples after a glucose challenge, facilitating post-prandial studies without the need for repeated blood draws. These advantages seems to be particularly helpful for studies of childhood obesity or gestational diabetes in pregnant women.
Insulin Assay Principle
This is an indirect sandwich ELISA kit. A “sandwich” is formed when both a capture anti-Insulin antibody and a detection anti-Insulin antibody bind Insulin. The detection antibody is directly linked to horseradish peroxidase. After incubation, unbound components are washed away. Bound anti-Insulin detection antibody is measured by the reaction of the horseradish peroxidase enzyme to the substrate tetramethylbenzidine (TMB). This reaction produces a blue color. A yellow color is formed after stopping the reaction with an acidic solution. The optical density is read on a standard plate reader at 450 nm. The amount of anti-Insulin detection antibody is directly proportional to the amount of Insulin present in the sample.
Diagnostic Salivary Insulin ELISA Kit
Add to Study
Salimetrics Assay #1-4410 (in vitro diagnostic use)
The Salimetrics® Insulin ELISA Kit For Diagnostic In-vitro use is specifically designed for the quantitative measurement of salivary insulin and requires only a low sample volume. This kit allows researchers to easily and painlessly collect multiple samples, facilitating studies on obesity and metabolics without the need for repeated blood draws.
Insulin, a core anabolic peptide hormone, regulates the metabolism of nutrients such as glucose and fatty acids, promoting their absorption into fat, liver, and skeletal muscle cells. Salivary insulin presents a unique opportunity to monitor insulin levels prior to and associated with disease progression. Elevated fasting insulin is a hallmark of insulin resistance, which can precede type 2 diabetes by several years and may justify lifestyle changes to reduce disease risk. Salivary insulin correlates closely with fasting blood levels and offers a reliable surrogate for serum measures.
Read More...| Assay Protocol |
|---|
| Rev. 08.15.25
|
| Specifications | |
|---|---|
| Catalog#: | 1-4410 |
| Regulatory Status: | Diagnostic |
| Format: | 96-well plate |
| Assay Time: | ~ 1 hr 15min |
| Sample Volume/Test: | 25 µL |
| Sensitivity: | 0.39 µIU/mL |
| Assay Range: | 0.39 – 300 µIU/mL |
| Storage Requirements: | 2-8°C |
| Tests Per Kit | |
|---|---|
| Singlet: | 76 |
| Duplicate: | 38 |
| Target Analyte |
|---|
Technical Documentation
3. Technical Summary
| Analyte Summary | |
|---|---|
| Analyte: | Insulin |
| Aliases: | INS, IDDM, IDDM1, IDDM2, ILPR, IRDN, MODY10 |
| Serum-Saliva Correlation: | 0.92 |
| *Optimum Collection Volume: | 100 μL |
| Special Considerations |
|---|
| Fasting Insulin: Do not consume food or beverage within eight hours prior to saliva collection. Time after eating – fasting measurements will differ than post-meal measurements. Glucose Challenge: Salivary insulin levels lag approximately 40 minutes behind blood levels. |
| Assay Summary | |
|---|---|
| Methodology: | ELISA |
| Sensitivity: | 0.39 µIU/mL |
| Assay Range: | 0.39 – 300 µIU/mL |
| Assay Type: | Quantitative |
Background
Insulin, a core anabolic peptide hormone, is responsible for regulating the metabolism of nutrients such as glucose and fatty acids to promote their absorption into fat, liver, and skeletal muscle cells. It also suppresses the breakdown of proteins into amino acids. Circulating insulin levels stimulate cellular glucose oxidation, glycogenesis, lipogenesis, and proteogenesis to maintain glucose homeostasis and are mainly modulated by beta cells in the islets of Langerhans and hyperglycemic hormones such as cortisol, glucagon and growth hormones. Multiple systems, as well as metabolic and neural influences co-function to regulate insulin levels. Prolonged deficiencies in insulin regulation have been linked to a myriad of health risks, including metabolic syndrome, obesity, diabetes mellitus, water bloating, high blood pressure, endocrine dysfunctions and increased levels of inflammatory compounds in the blood. In saliva, insulin shares a near linear correlation to fasting blood levels and is a reliable surrogate for serum measures, with a 0.92 correlation (Fabre 2012). During an oral glucose tolerance test, research shows a ~30 minute delay between salivary insulin and the spike in serum insulin levels (Fekete 1993). Overall, salivary insulin presents a unique opportunity to monitor insulin levels prior to disease progression. Elevated fasting insulin is a hallmark of insulin resistance, which can precede type 2 diabetes onset by several years and may be used to justify changes in lifestyle to reduce the risk of disease (Tomoshige Hayashi 2013).
References & Salivary Insulin Research
- Goodson, JM, et al. (2014). Metabolic Disease Risk in Children by Salivary Biomarker Analysis. PLoS One. 9(6): e98799.
- Fekete Z, et al. (1993). Salivary and plasma insulin levels in man. Biochem Mol Biol Int. 30(4): 623–629.
- Fabre B, et al. (2012). Measurement of fasting salivary insulin and its relationship with serum insulin in children. Endocr Connect. 1(2): 58–61.
- Hartman ML, et al. (2016). Unhealthy Phenotype as Indicated by Salivary Biomarkers: Glucose, Insulin, VEGF-A, and IL-12p70 in Obese Kuwaiti Adolescents. J Obes. 2016: 6860240.
- Ebbeling CB, et al. (2002). Childhood obesity: public-health crisis, common sense cure. Lancet. 360(9331):473-82.
- Zhao X, et al. (2016). Using Metabolomic Profiles as Biomarkers for Insulin Resistance in Childhood Obesity: A Systematic Review. J Diabetes Res. 2016:8160545.
- D’Adamo E, et al. (2011). Type 2 diabetes in youth: epidemiology and pathophysiology. Diabetes Care. 34 Suppl 2:S161-5.
- Hayashi T, et al. (2013). Patterns of Insulin Concentration During the OGTT Predict the Risk of Type 2 Diabetes in Japanese Americans. Diabetes. 36(5): 1229-1235.